NPM-DGM-HAH 2 jaar
NPM-DGM-HAH 2 jaar
NPM-DGM-HAH 2 jaar 2025
NPM-DGM-HAH 2 jaar 2025 Resultaten HAH-kranten
NPM-DGM-HAH 2 jaar 2025 Merkenlijst
NPM-DGM-HAH 2 jaar 2025 Toelichting bereikscijfers HAH-kranten
NPM-DGM-HAH 2 jaar 2025 Leesduur landelijk en regionale dagbladen
NPM-DGM-HAH 2 jaar 2025 Onderzoeksverantwoording
NPM-DGM-HAH 2 jaar 2025 HAH-kranten infographic
NPM-DGM-HAH 2 jaar 2024
NPM-DGM-HAH 2 jaar 2024 Resultaten HAH-kranten
NPM-DGM-HAH 2 jaar 2024 Merkenlijst
NPM-DGM-HAH 2 jaar 2024 Toelichting bereikcijfers HAH-kranten
NPM-DGM-HAH 2 jaar 2024 Leesduur landelijke en regionale dagbladen
NPM-DGM-HAH 2 jaar 2024 Onderzoeksverantwoording
NPM-DGM-HAH 2 jaar 2024 HAH-kranten infographic
NPM-DGM-HAH 2 jaar 2023
NPM-DGM-HAH 2 jaar 2023 Resultaten HAH-kranten
NPM-DGM-HAH 2 jaar 2023 Merkenlijst
NPM-DGM-HAH 2 jaar 2023 Toelichting bereikcijfers HAH-kranten
NPM-DGM-HAH 2 jaar 2023 Leesduur landelijke en regionale dagbladen
NPM-DGM-HAH 2 jaar 2023 Onderzoeksverantwoording
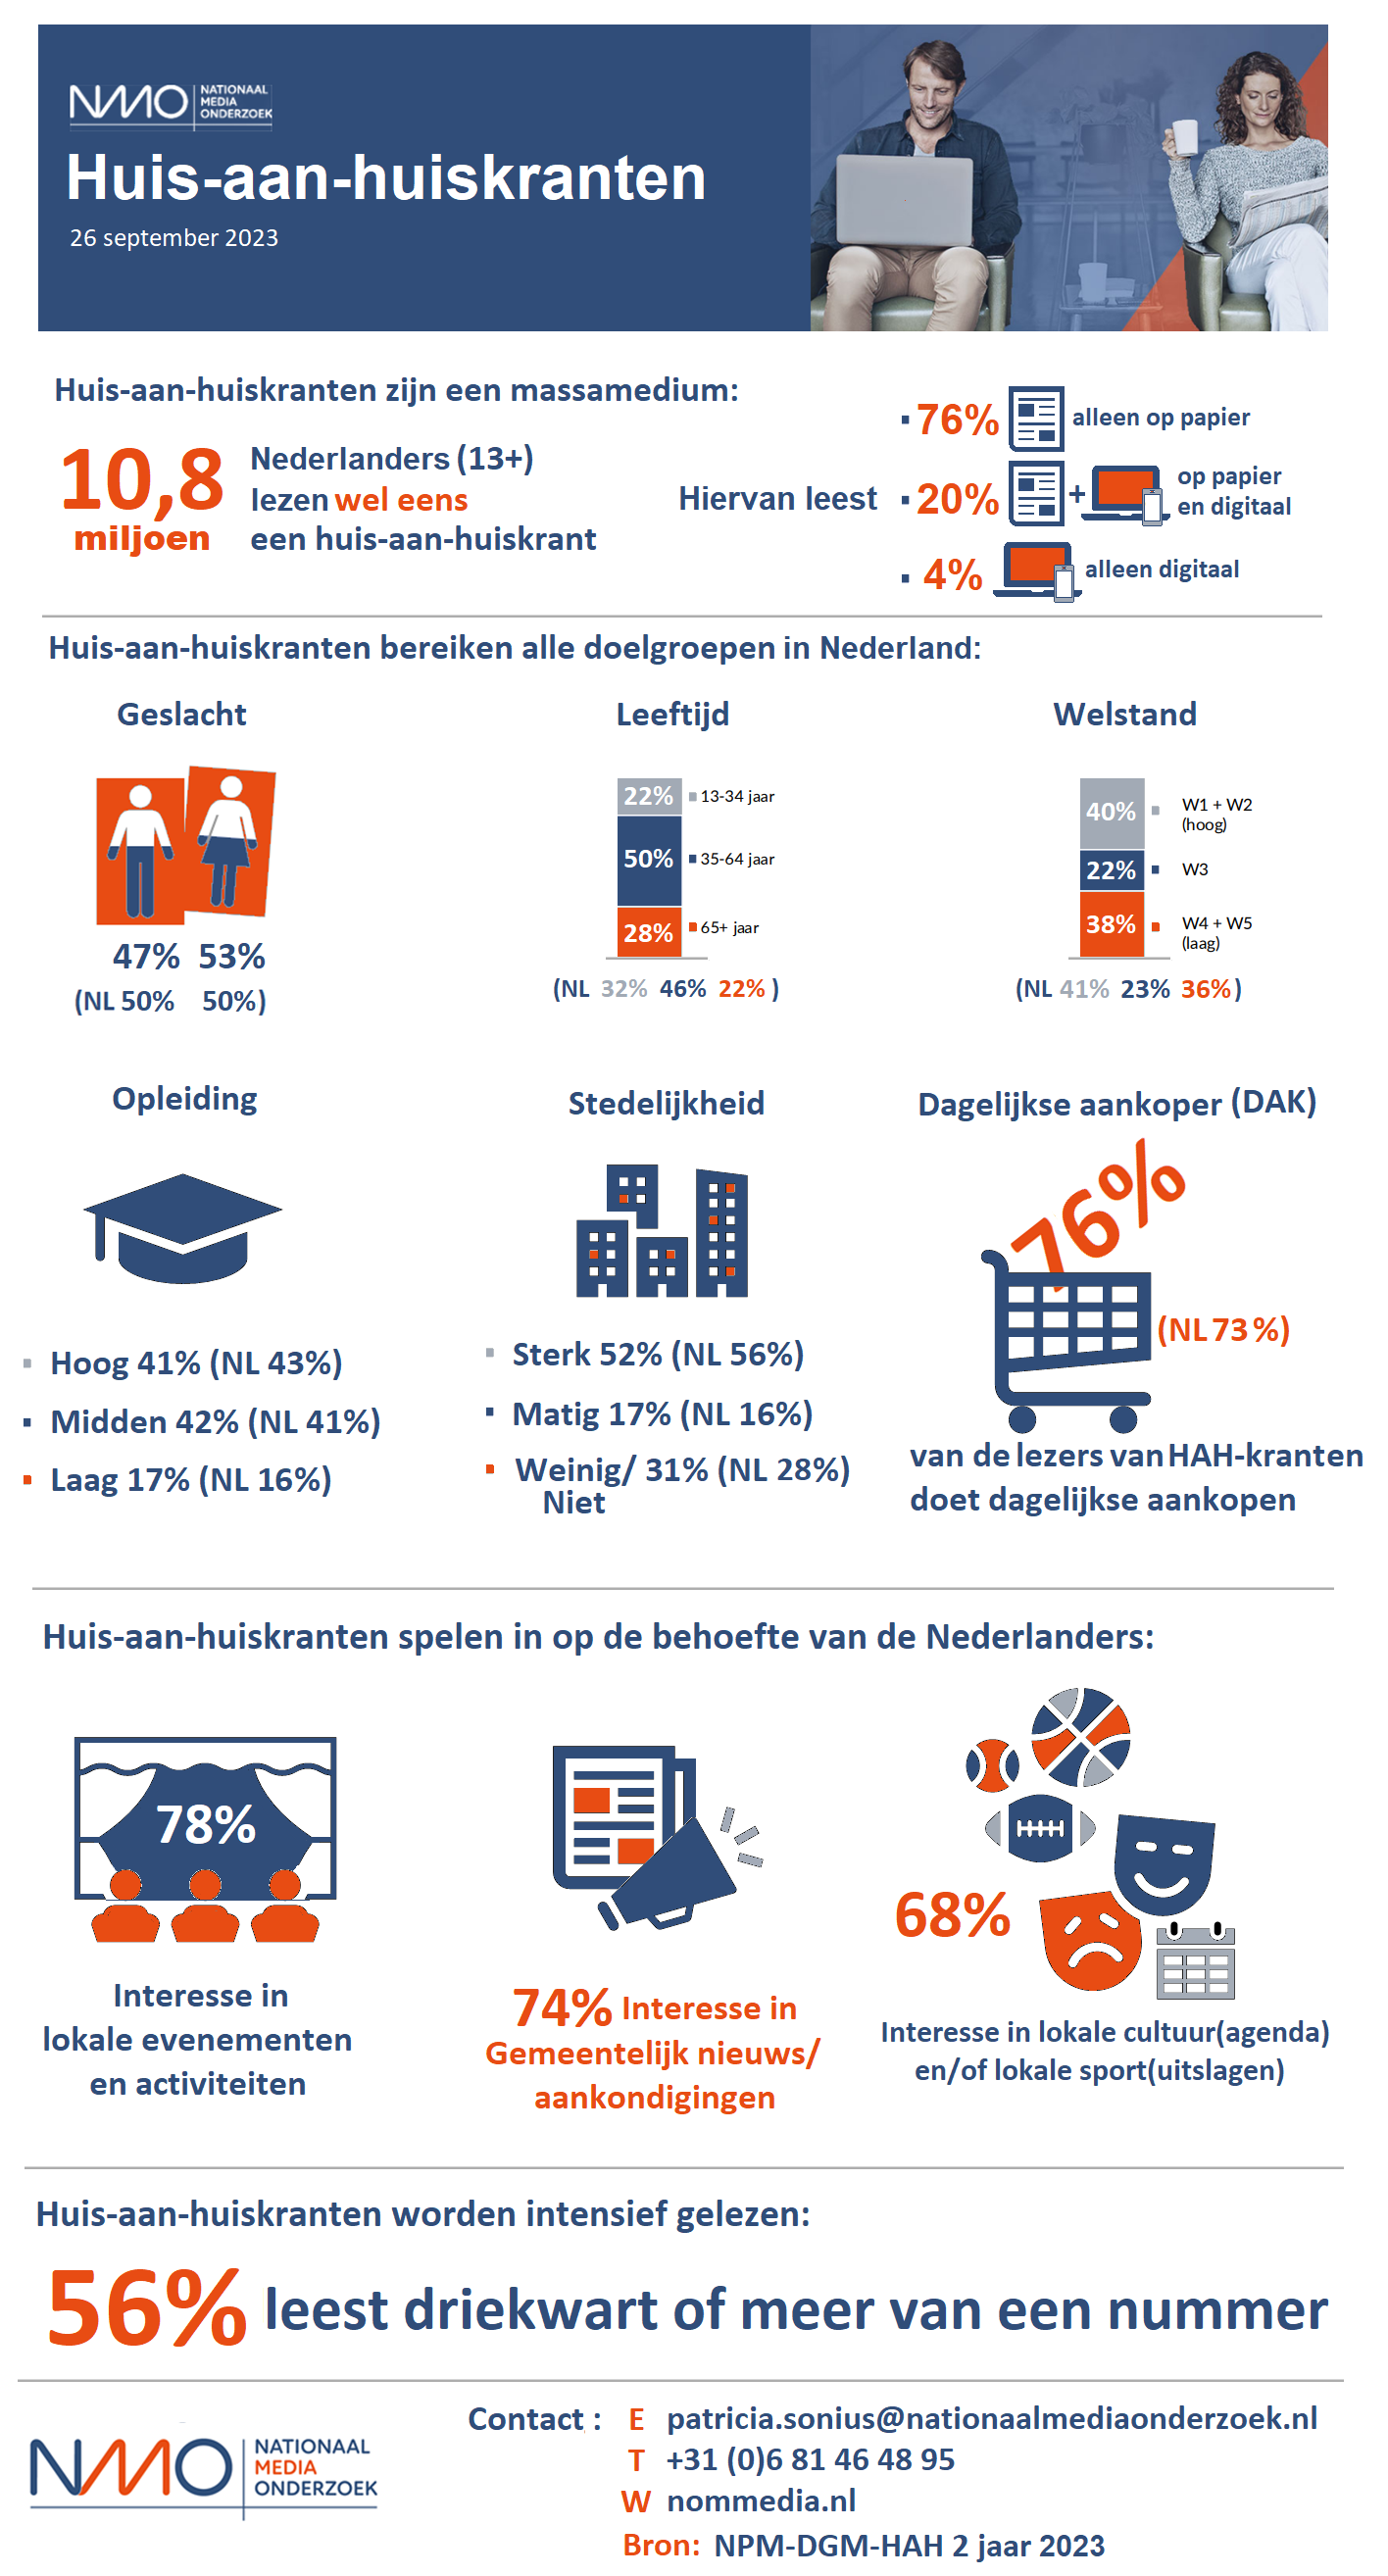
NPM-DGM-HAH 2 jaar 2023 HAH-kranten infographic
NPM-DGM-HAH 2 jaar 2022
NPM-DGM-HAH 2 jaar 2022 Resultaten HAH-kranten
NPM-DGM-HAH 2 jaar 2022 Merkenlijst
NPM-DGM-HAH 2 jaar 2022 Toelichting bereikcijfers HAH-kranten
NPM-DGM-HAH 2 jaar 2022 Leesduur landelijke en regionale dagbladen
NPM-DGM-HAH 2 jaar 2022 Onderzoeksverantwoording
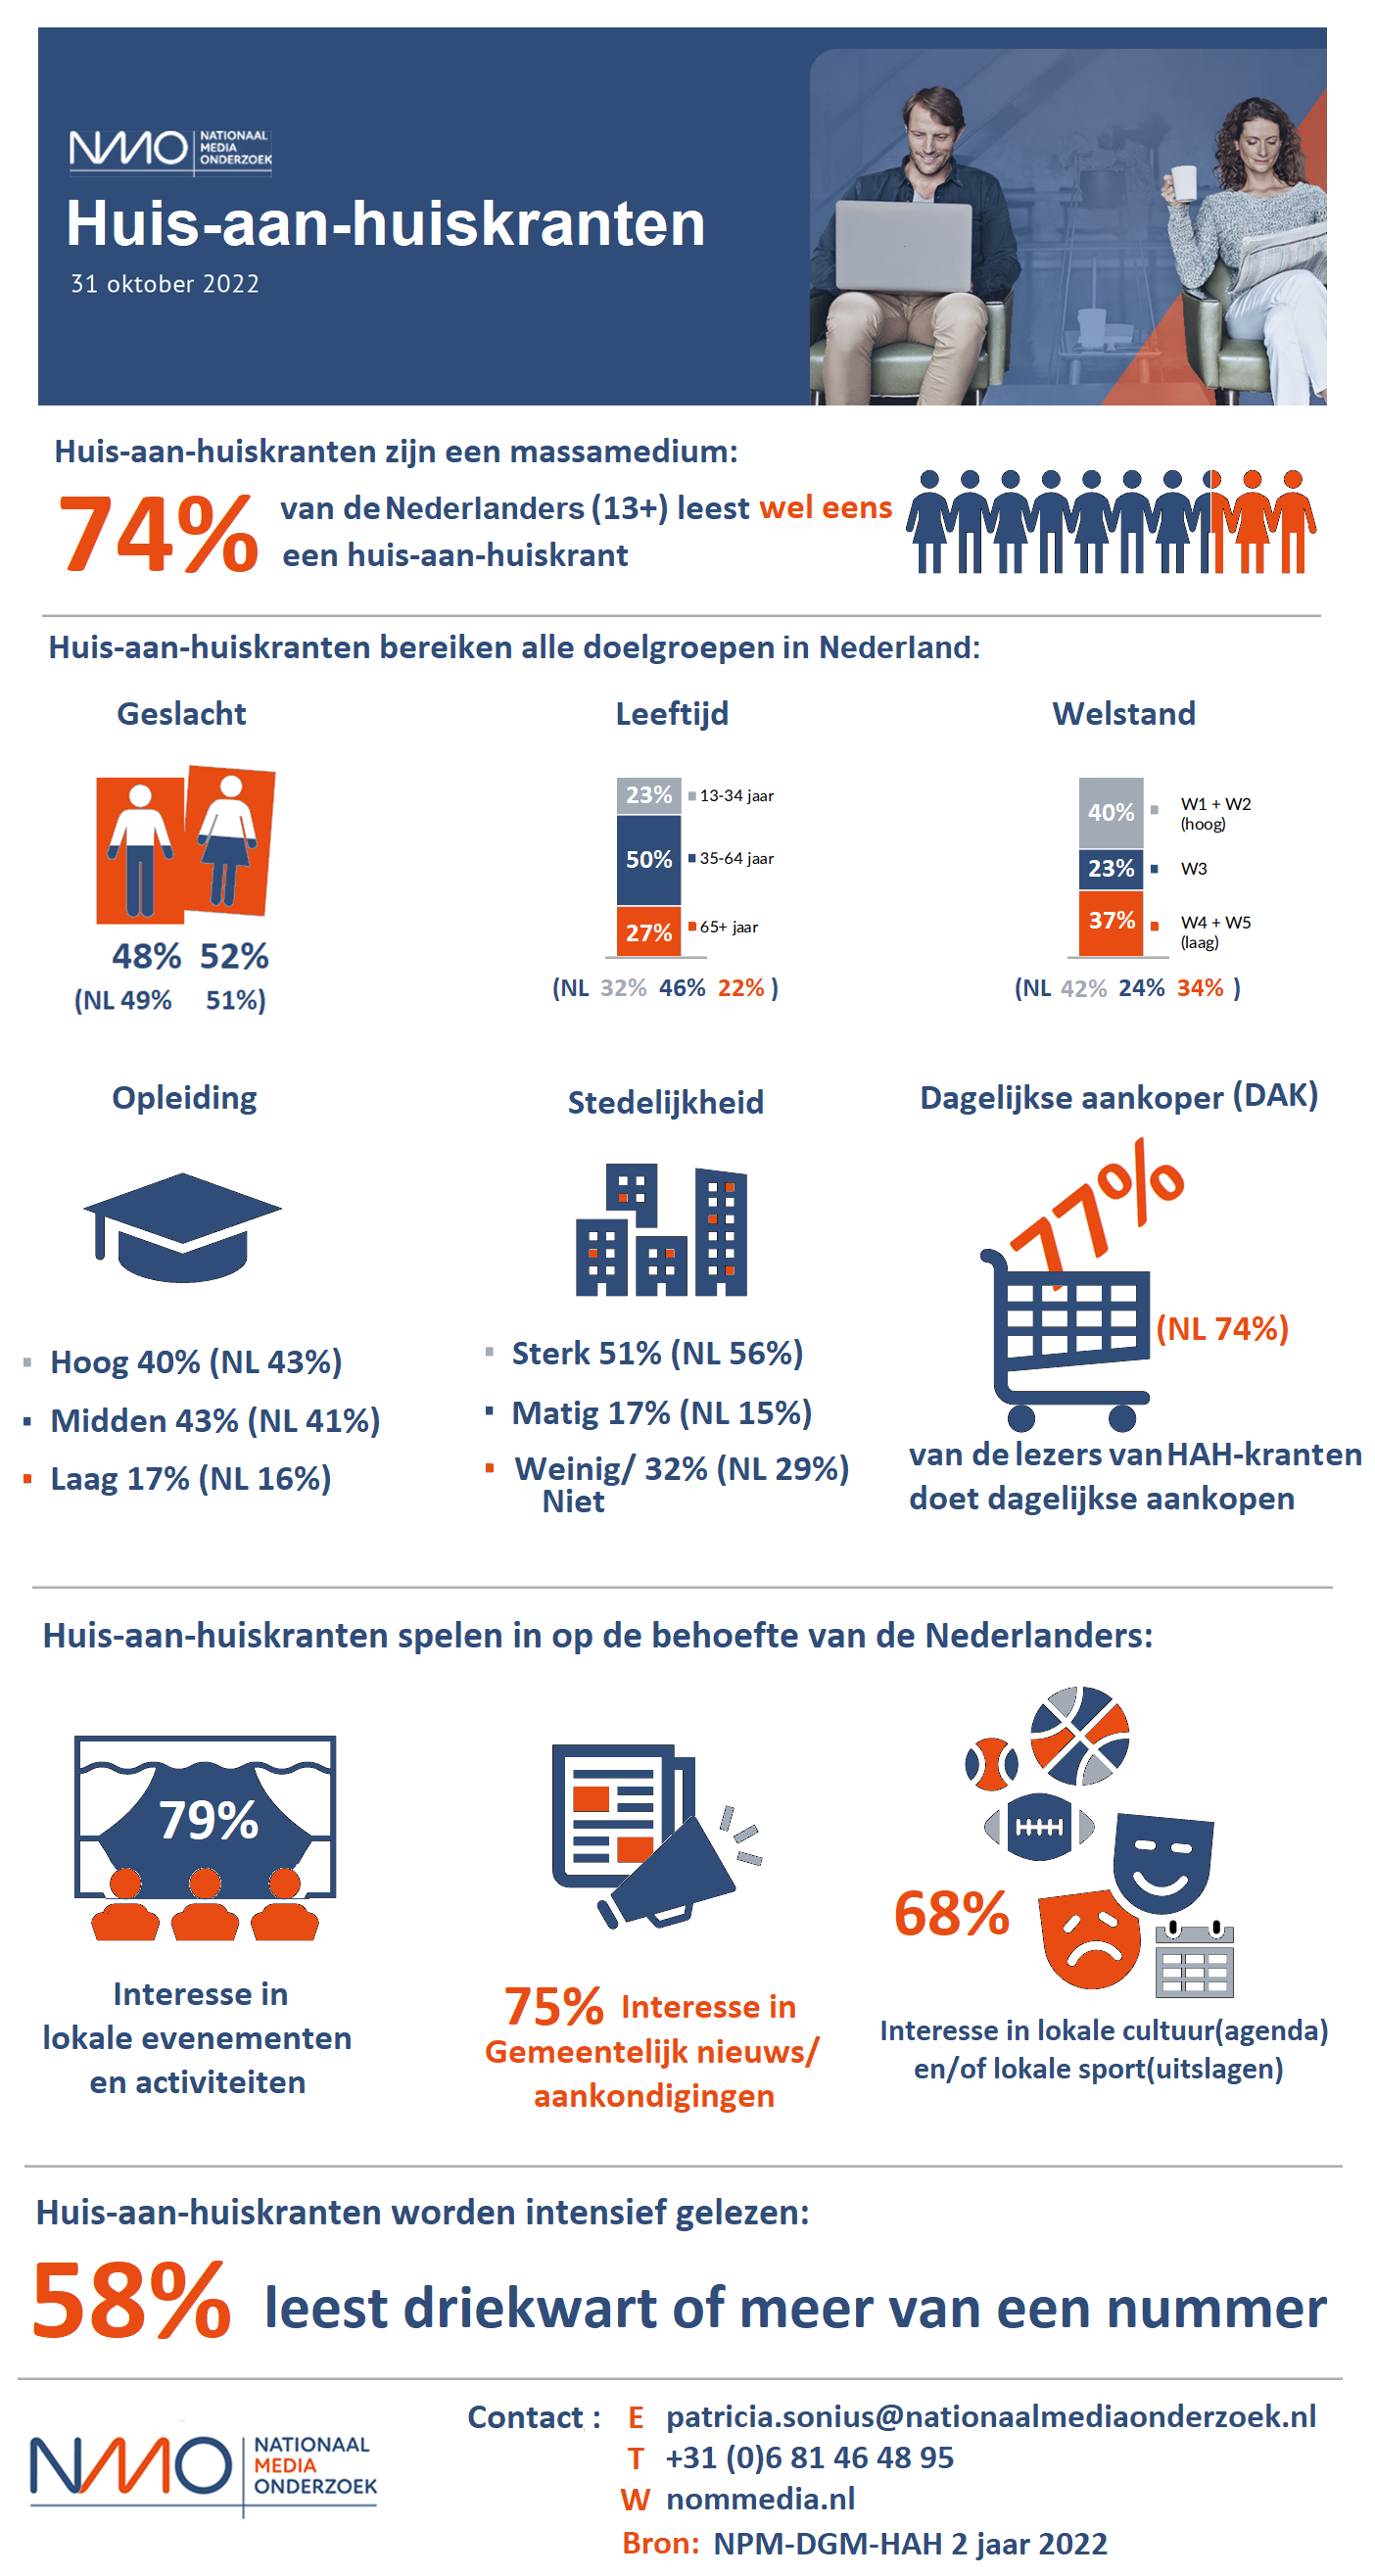
NPM-DGM-HAH 2 jaar 2022 HAH-kranten infographic
Overzicht
- Raadplegingen: 81